
From a customer:
Does Hydra Cad produce a printable fire pump curve graph? I have some fire pump results and they are wanting a graph.
This question probably arises because the HydraCALC standard Water Supply Graph does not show solely the Pump curve when there is a City and Pump inputted, for clarity sake. It only shows a combined City Supply and Pump Curve. If there is only a Pump inputted, then the Pump Curve will print, but the Water Supply Graph might be too cluttered for some, and they only want to see the Pump Curve.
Fortunately, there is an easy way to do this using HydraVIEW.
Open HydraVIEW.
Pick the Tools dropdown menu and then pick Draw WSC (Water Supply Curve)
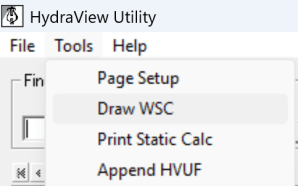
This will bring up the following dialog box:
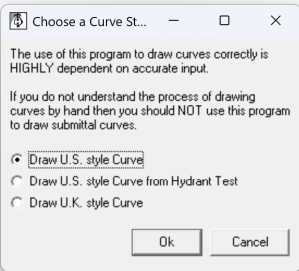
As you can see, there are three options. The first is the most common one – drawing a standard US style water supply curve. The second will draw a pump curve from a hydrant test. Pick OK with the first one selected.
This displays the input screen for a custom water supply curve. Notice you can enter the information concerning all aspects of the multiple curves that HydraCALC prints on the water supply graph
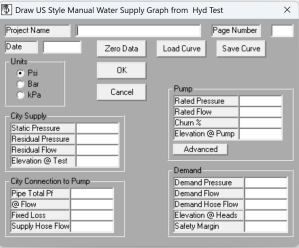
Here we will concern ourselves only with the pump curve
NFPA13 Conforming Pump
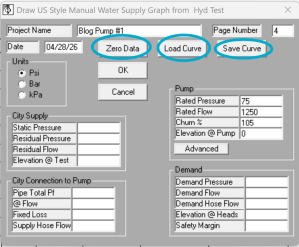
For a standard NFPA13 pump curve, we would input information into the Pump area. Below, I have entered in the information for that pump, including the Rated Pressure, Rated Flow, Churn percentage and Elevation of the pump, in feet.
I have also entered in a Project Name and a Page Number for this graph, so I can add it to my regular printout.
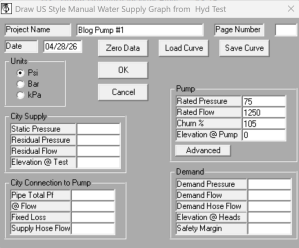
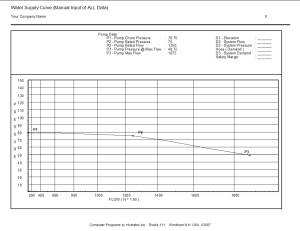
Picking OK will result in that curve getting generated:
Non-NFPA13 Pump or Pump Test
If you want to print a pump curve for a pump you have run a test on, or it is a pump that does not conform to NFPA13, you can use the Advanced button to create that pump.
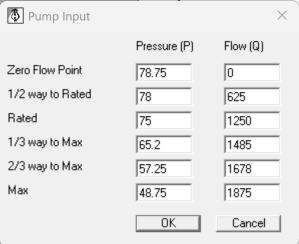
Put in the results of your pump test to create a curve.
Lastly, notice there are button to save this curve and load it again for another job. The Zero Data button simply clears the entries in the dialog box.

Leave a comment